
Find the roster gaps. Get to the cause.
Rostering intelligence reads your rostering system’s own export and shows where shifts go unfilled, why, and what it is costing. Deterministic analysis does the counting. AI explains it in plain language, with every number checked against the evidence before you see it.
Review-only by design. Works from an export. De-identified before anyone sees a screen.
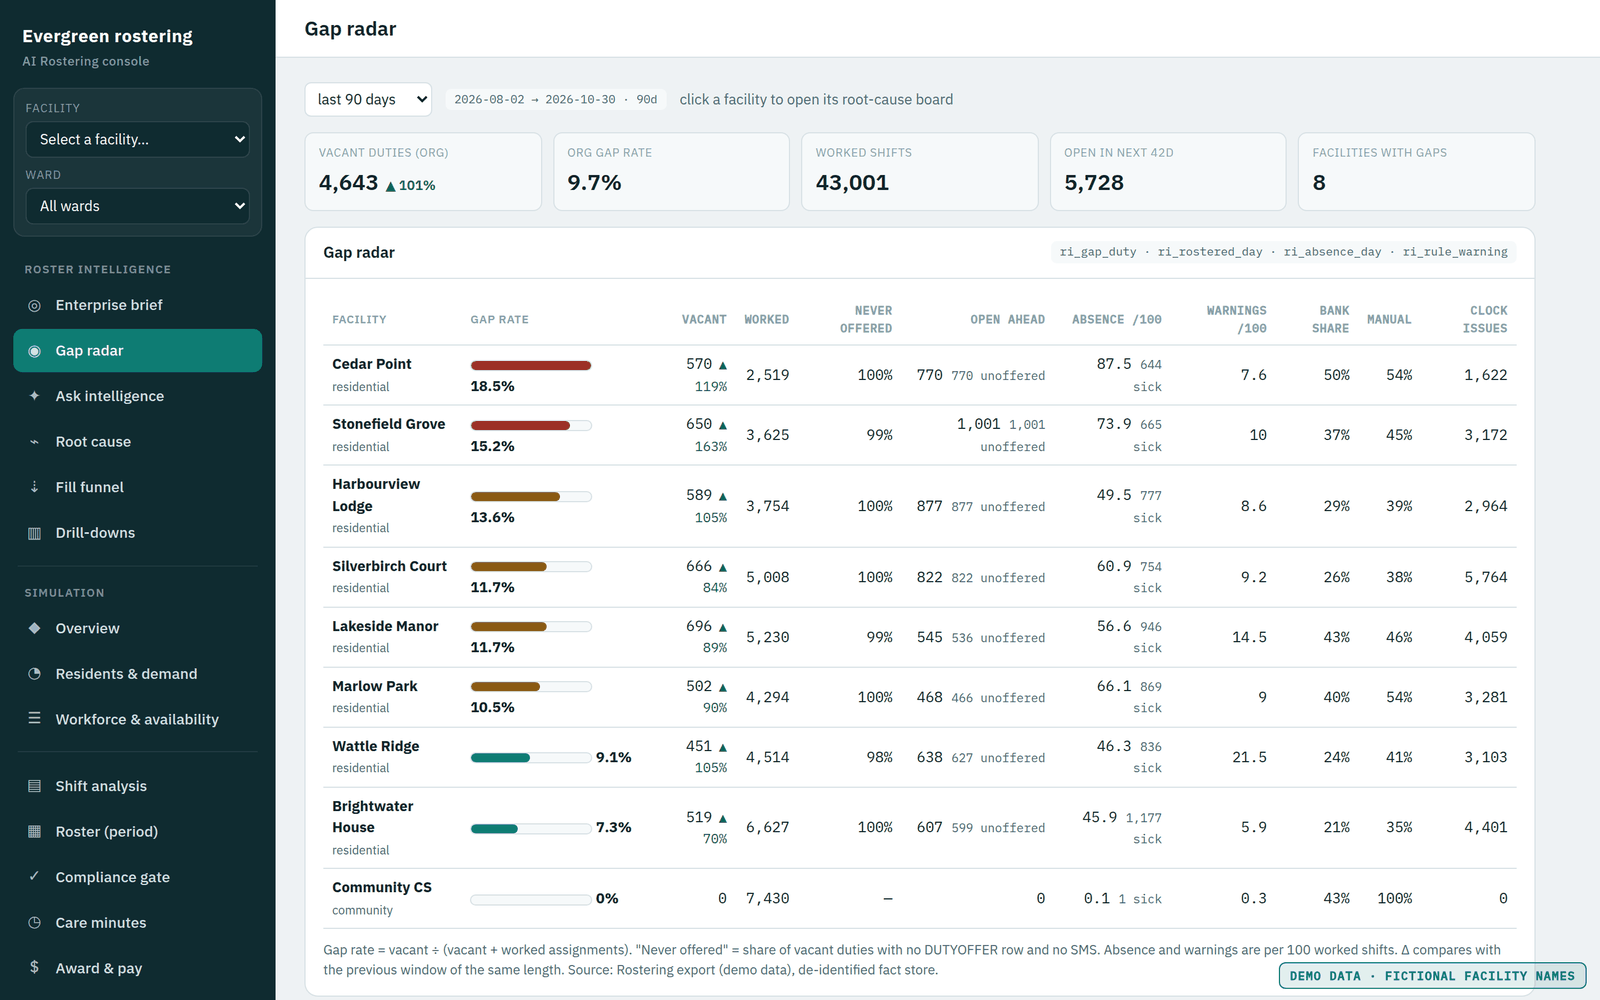
Eight homes. Ninety days. One leak hiding in plain sight.
The figures below come from a live deployment across eight residential homes, de-identified. Yours will differ. The pattern probably will not.
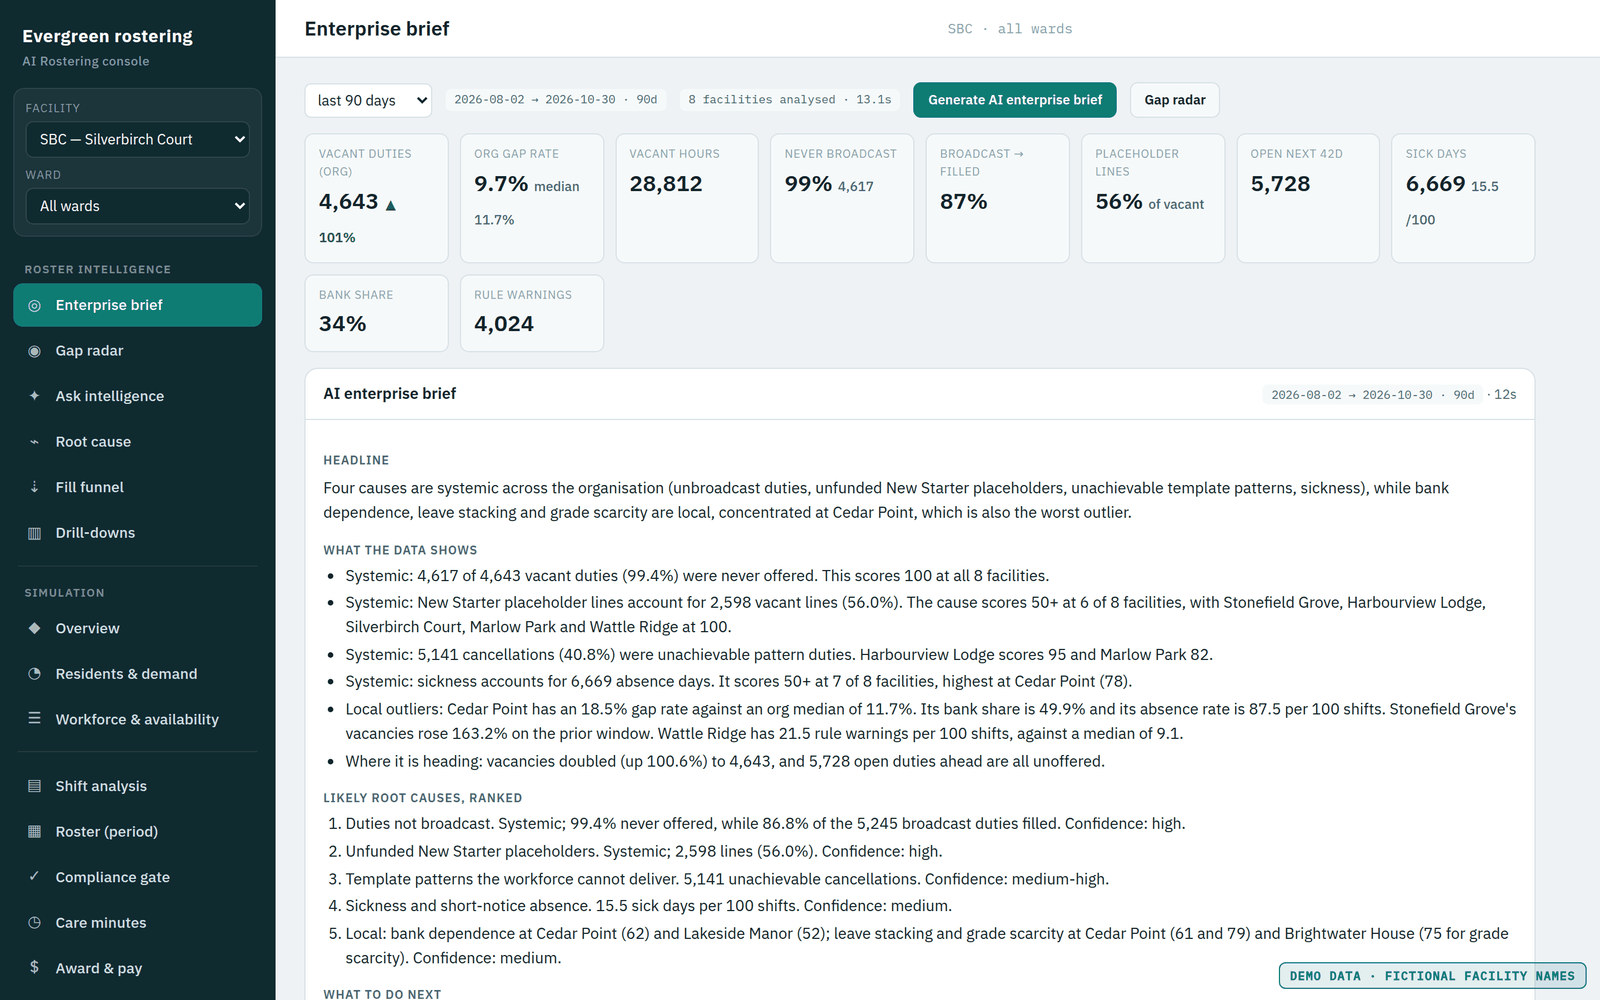
of vacant duties were never offered to anyone.
4,617 of 4,643 unfilled shifts in ninety days. The bank and casual pool never saw them.
of shifts that were broadcast got filled.
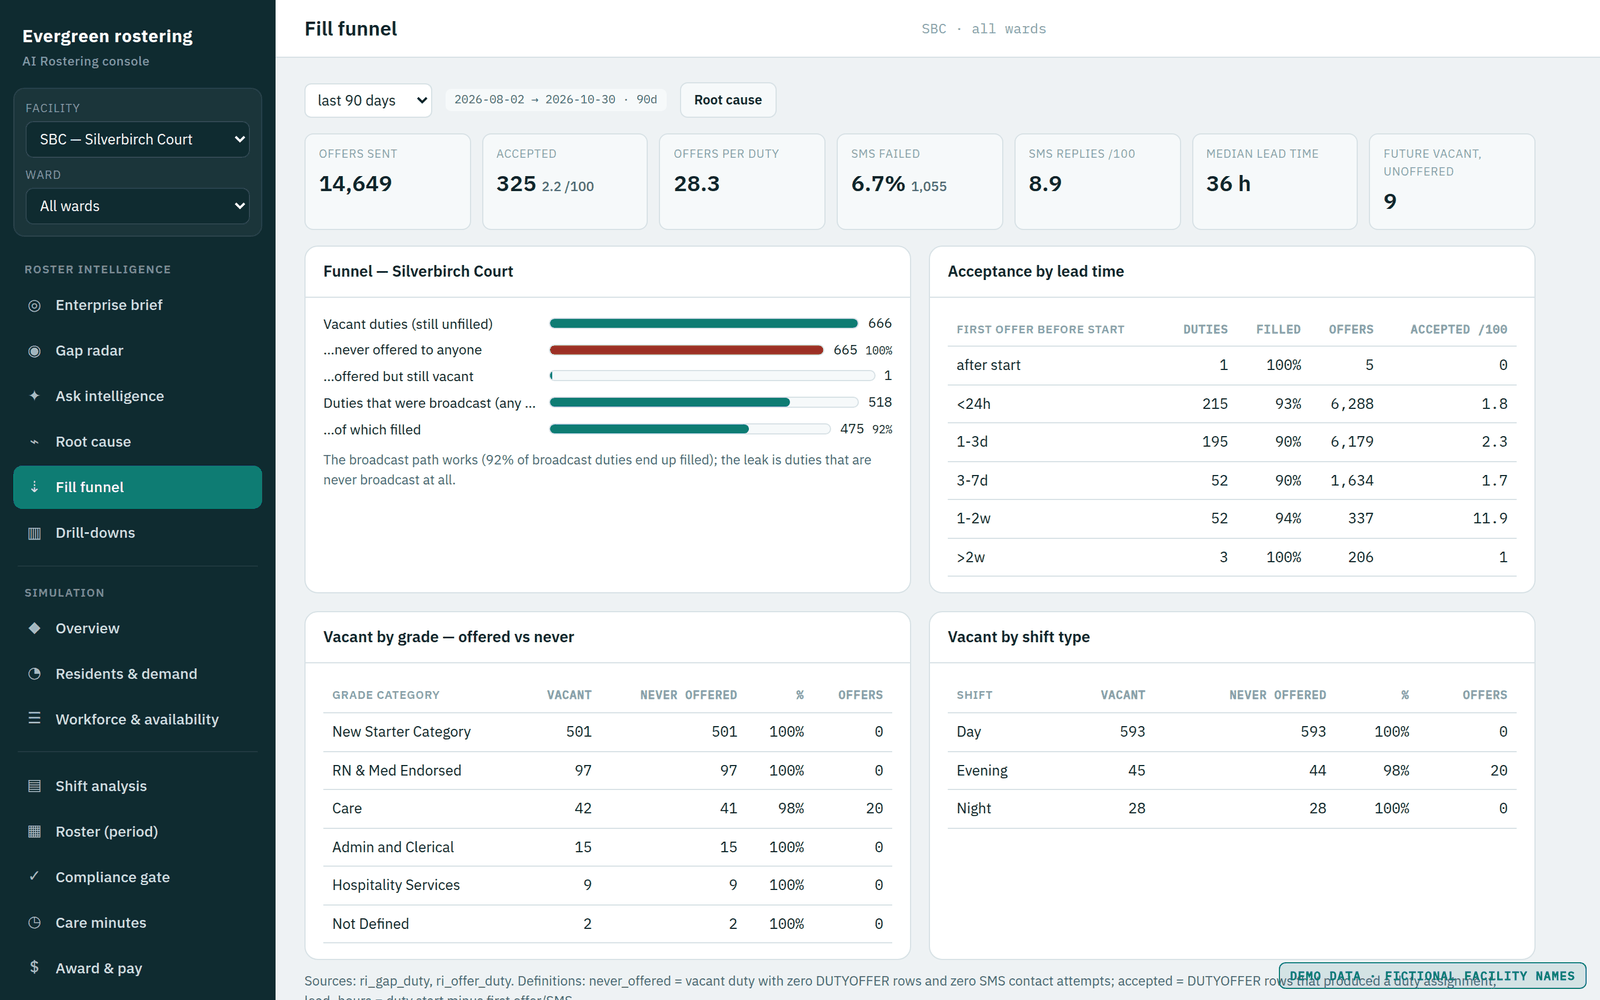
The fill process is not the problem. The leak sits upstream of it.
of vacant duties sat on template lines with no funded person.
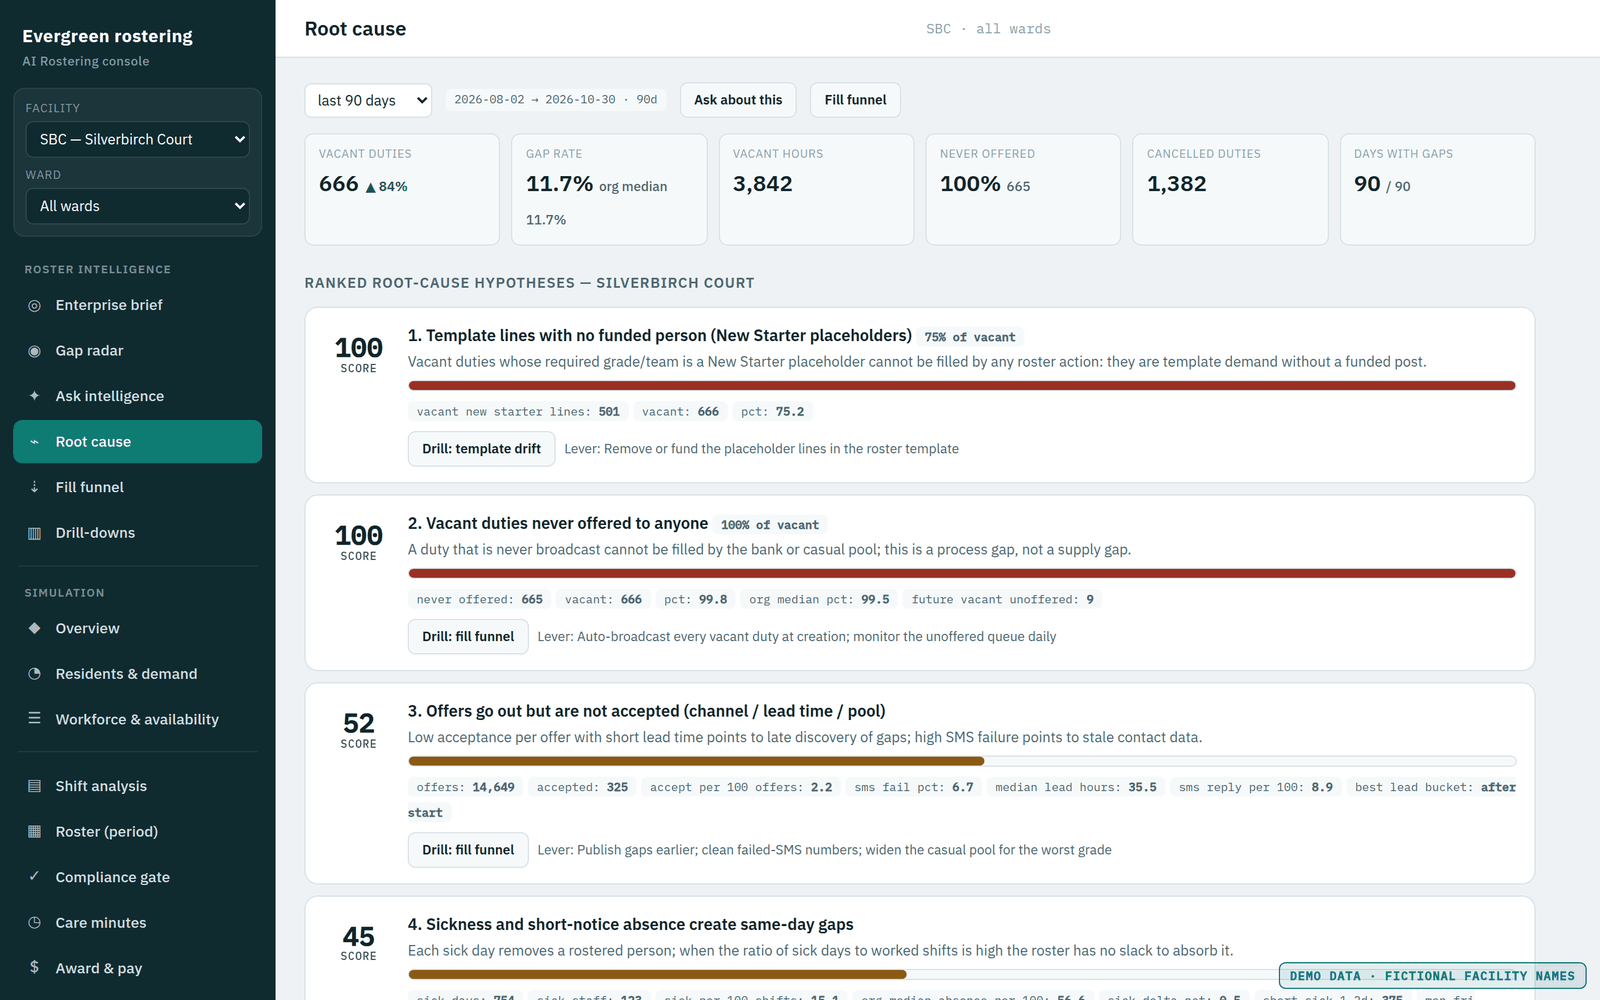
Placeholder lines no roster action can fill, inflating every gap report.
of cancelled duties were ones the work patterns could never deliver.
5,141 duties cancelled as unachievable before anyone was sick.
of worked shifts came from the bank.
At one home it was half. Recurring bank hours are contracted lines in disguise.
SMS offers sent to fill 2,853 shifts.
Thirty-nine messages per acceptance, and half of all assignments made by hand.
De-identified figures from one provider’s rostering export, last ninety days at the time of analysis. They describe that deployment, not the sector, and are not a recoverable savings rate.
An unfilled shift is never free.
It is paid for somewhere else: in premium cover, in care minutes you have committed to deliver, and in leaders’ time spent plugging the roster shift by shift.
Bank, agency, casual loading and overtime
A gap found on the day is filled at the highest price available. A gap found two weeks out is usually filled at ordinary rates. Offers sent one to two weeks ahead were accepted at six times the rate of offers sent inside 24 hours.
Funded minutes you did not deliver
Every unfilled care duty is time you are funded to provide and have committed to report. The same screen that shows the gap shows which grade and which shift it sits in, so the care-minute exposure is visible before quarter end.
The hidden roster
Half of all assignments made by hand, 4,024 rule warnings in ninety days, and tens of thousands of texts. That is leaders’ time, and it is fatigue exposure for the same people who keep saying yes.
Facts first. Then the AI explains.
Your rostering export becomes a de-identified fact store: every unfilled and cancelled duty, every offer and reply, every absence day, rule warning and bank booking. Deterministic tools do the counting and rank ten root-cause hypotheses. The AI reads that evidence and writes the explanation.
Load the export
Your rostering system’s standard export becomes the fact store in about ninety seconds. Nothing is installed in your systems.
Rank the causes
Ten hypotheses are scored for every home: never offered, unfunded template lines, unachievable patterns, absence pressure, grade scarcity, bank dependence and more.
Ask in plain language
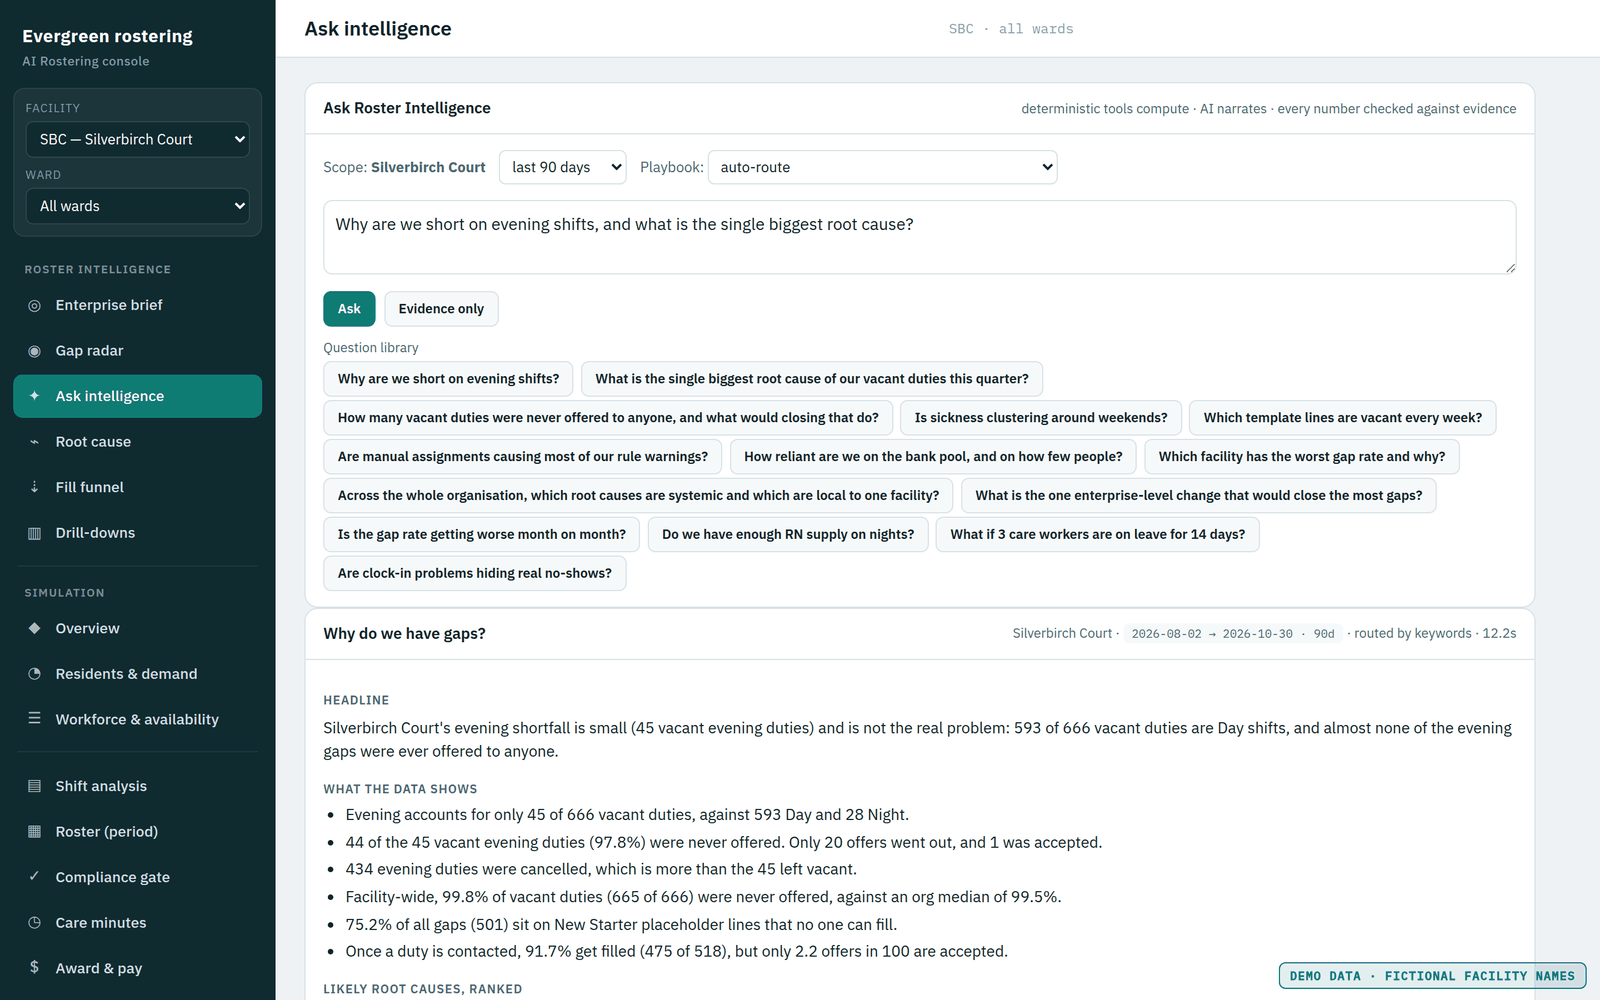
“Why are we short on evenings?” routes to the right analysis, runs it, and returns a grounded answer with the drill-downs behind it.
Act and track
Save the finding, agree the lever and the owner, and watch the same screens the following month.
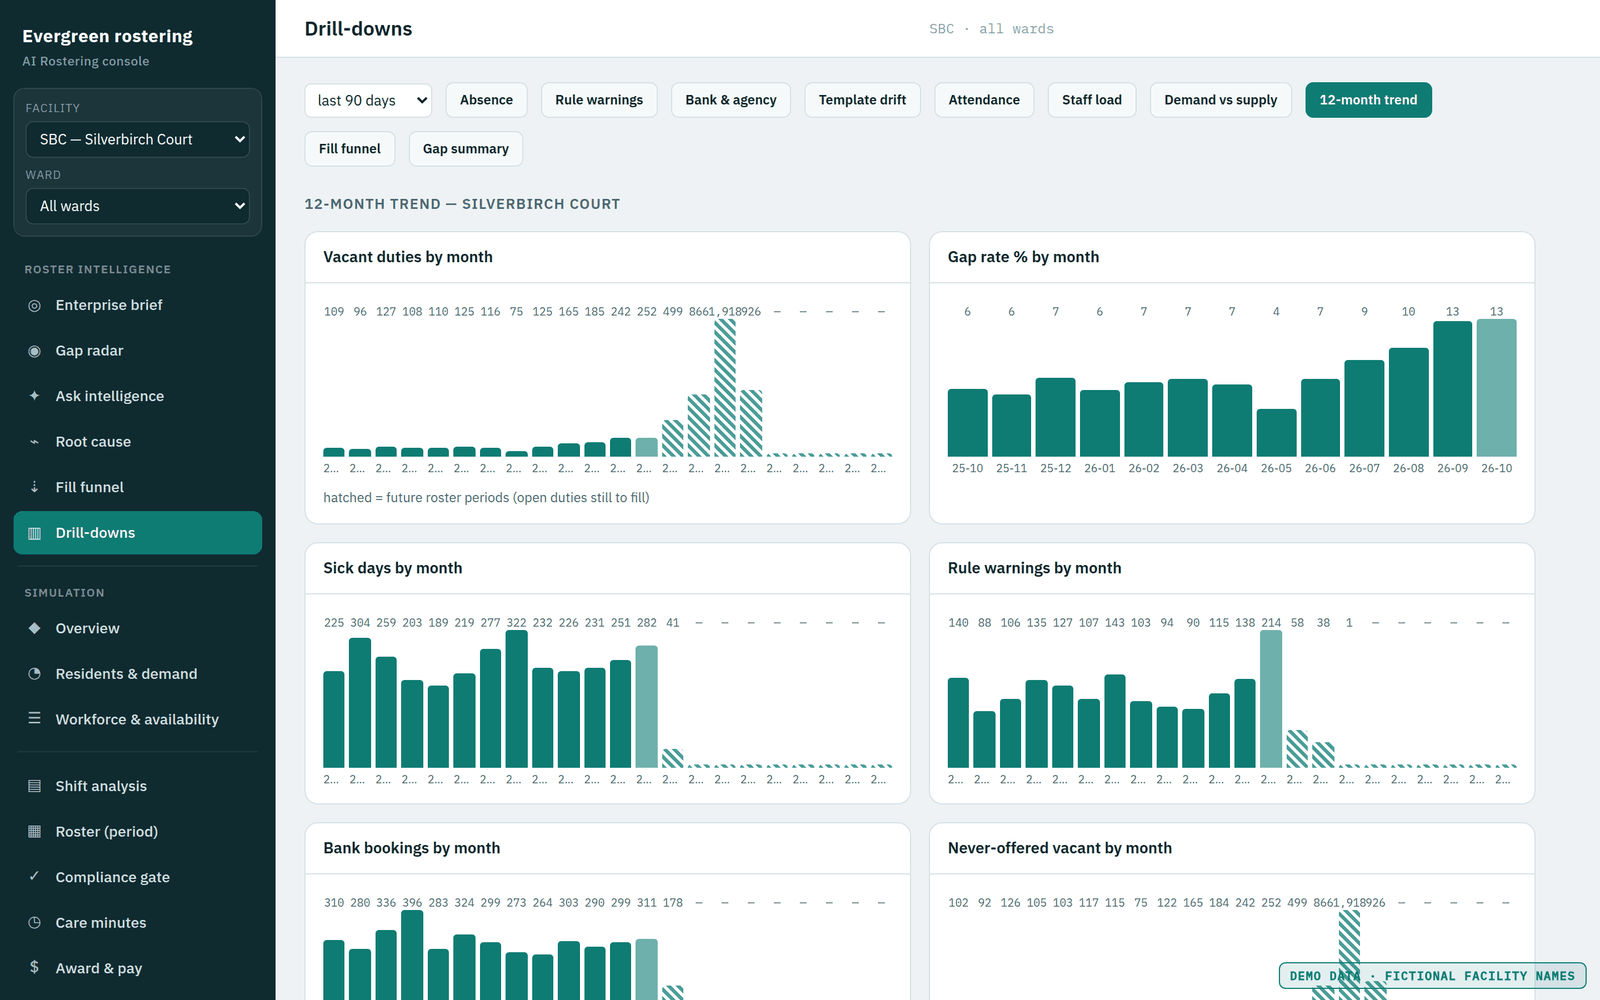
Six screens, one question: where is the gap, and why?
Illustrative screens from the deployment above, de-identified. Facility names are fictional.
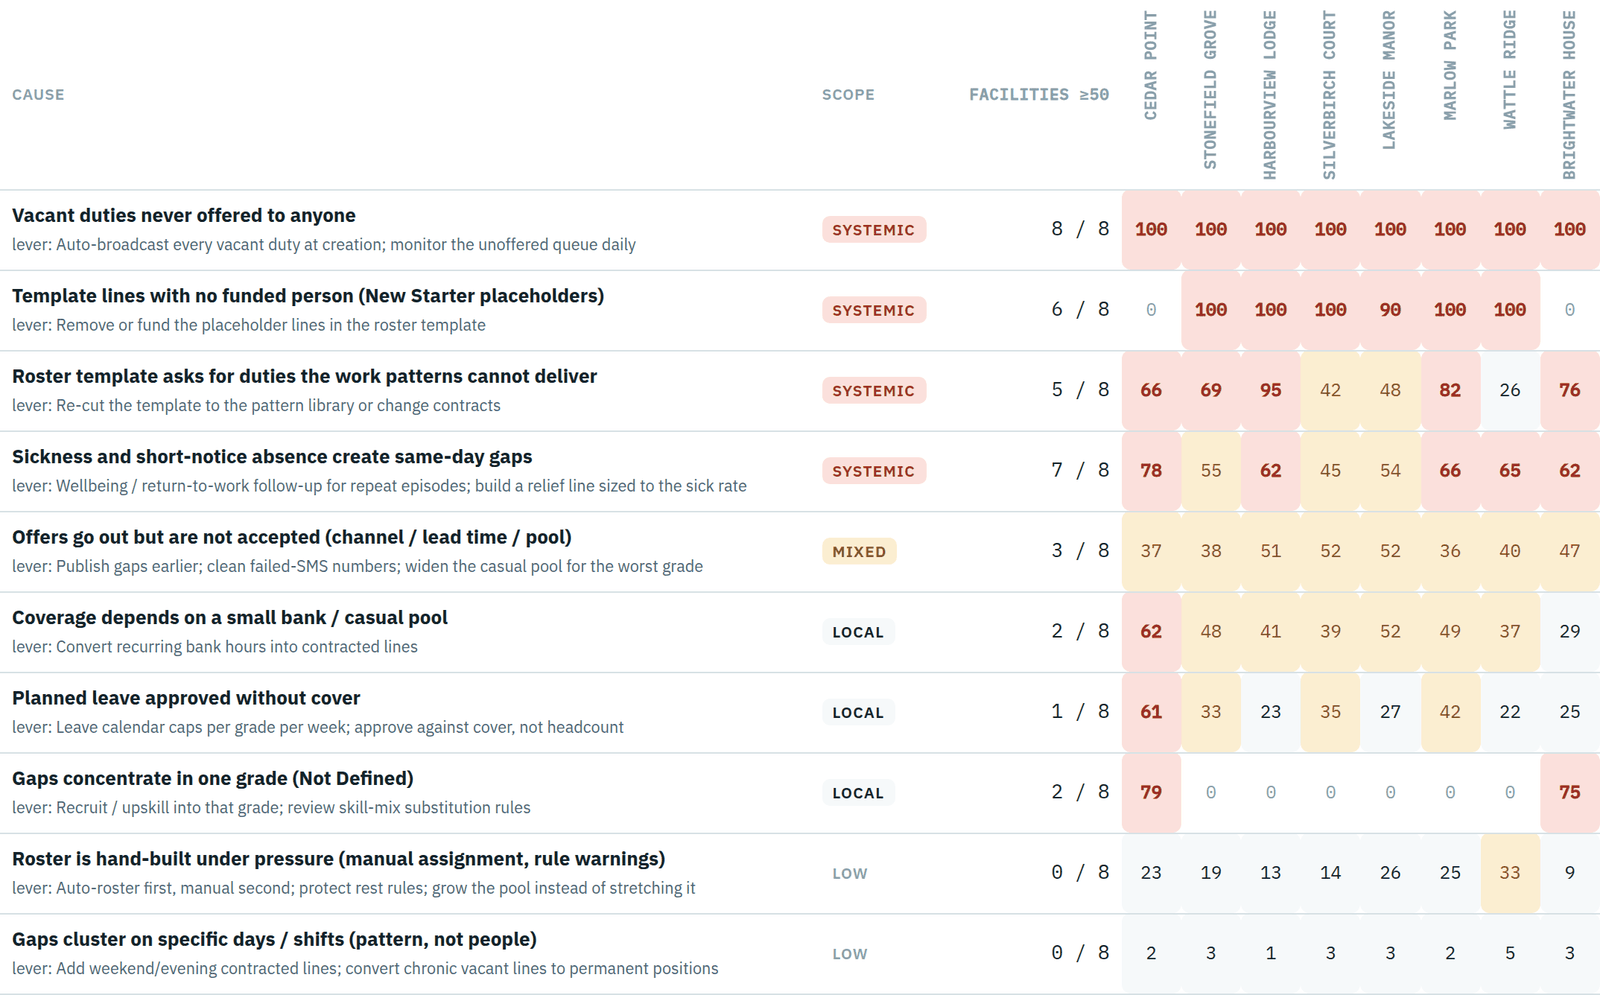
Systemic or local? Now you can tell.
The same root-cause ranking runs for every home, then the numbers are pooled. A cause that scores high at most homes is systemic and belongs to head office: the template, the broadcast rule, the leave policy. A cause that scores high at one or two homes is local and belongs to a conversation with a manager.
In the deployment above, four causes were systemic and three were local. Two homes were outliers on gap rate and bank share. That is a different board paper from “agency spend is up”.
Built to be trusted in a board pack.
Review-only
Nothing is written back to your rostering system. People decide; the platform prepares the evidence.
Every number cited
Each screen names its source tables and definitions. Each AI answer is checked against its evidence.
De-identified
Staff numbers only. No names, contacts or health detail in the database, the model or on screen.
Hypotheses, not verdicts
Cause scores rank what to investigate first. They are evidence for a conversation, not causal proof.
See it on your own export.
A two-week pilot. You provide a de-identified rostering export; we return the gap radar, a root-cause board for every home and an enterprise brief. Scope and data handling are agreed first.
- Works from your rostering system’s standard export.
- De-identified before load. Staff numbers only.
- Review-only. Your people decide every action.
Start the conversation
We reply within two business days.
Thanks — we'll be in touch
We reply within two business days.