Eight modules. One connected view.
Every module draws on the same clinical, workforce and operational data. Start where the pressure is and switch the rest on as value is proven.
Every signal has somewhere to go.
A risk becomes an owned action. An incident becomes learning. A policy becomes evidence.
See the exposure
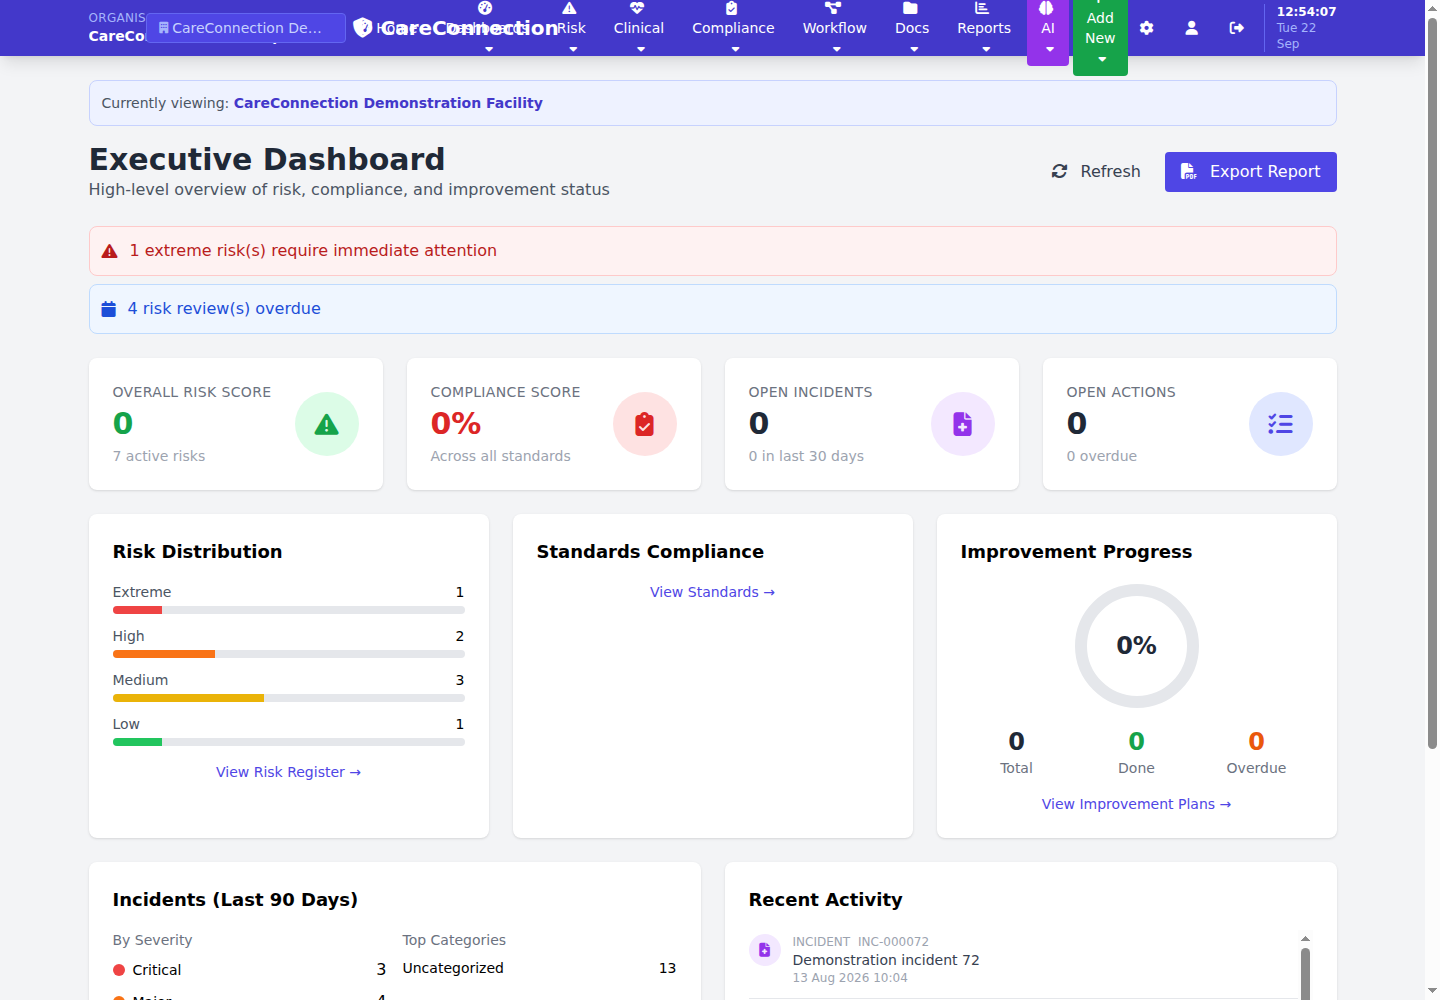
Risk, standards, incidents and improvement progress in one leadership view.
Understand the signal
AI highlights what deserves attention, with the source evidence one click away.
Act in the workflow
Assessments, care plans, incidents and improvement plans give each finding a next step.
Prove what changed
Document history and activity logs keep ownership visible when scrutiny arrives.
Start where the pressure is. Expand as value is proven.
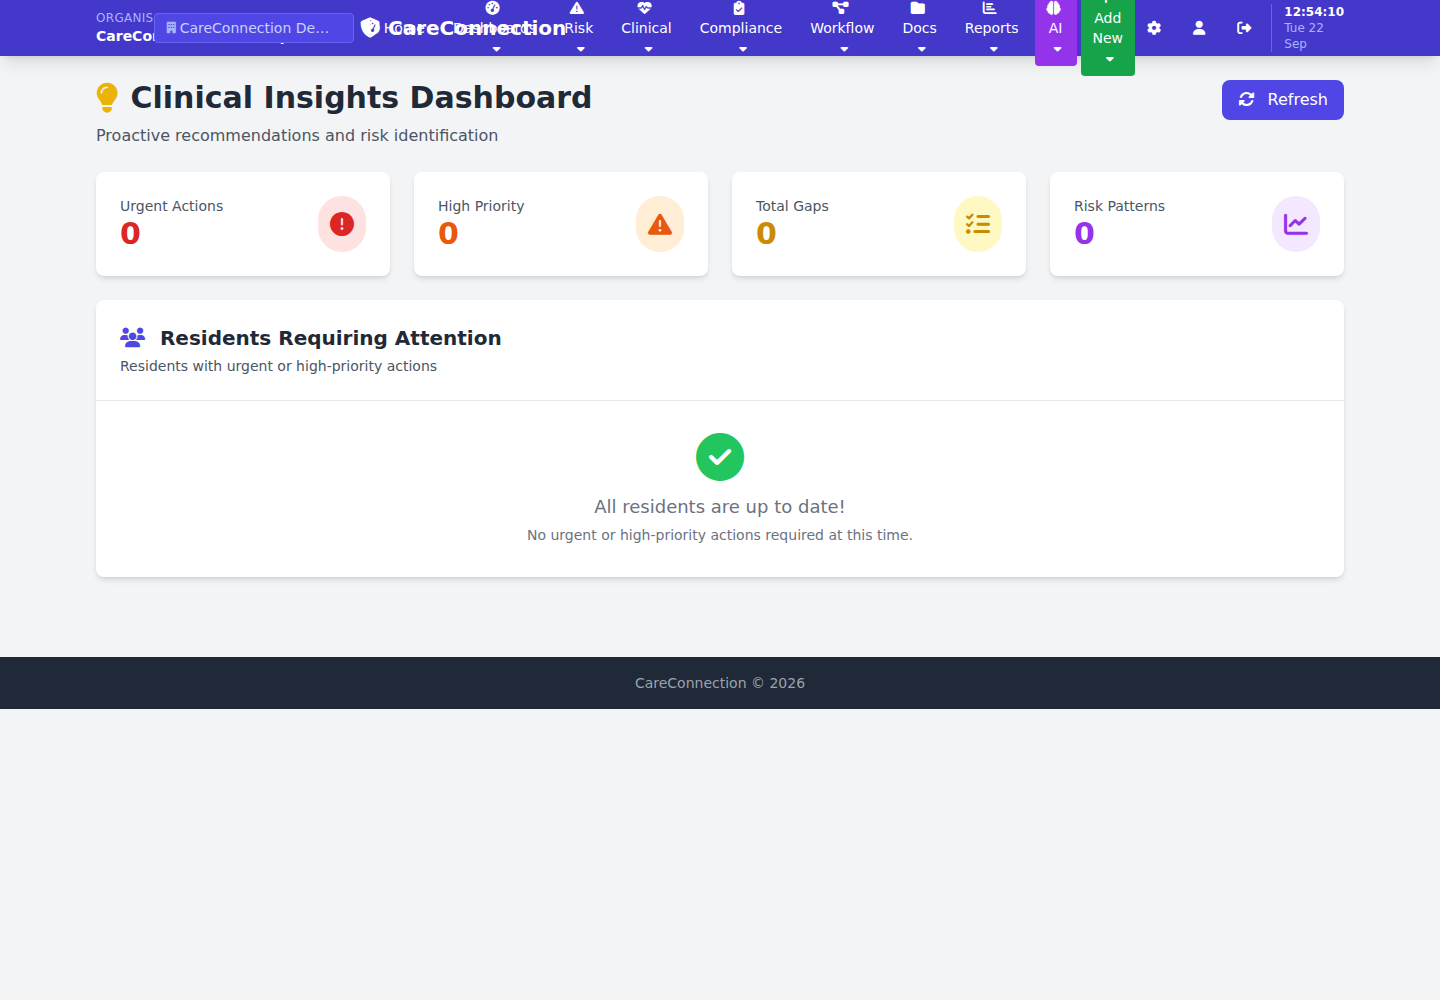
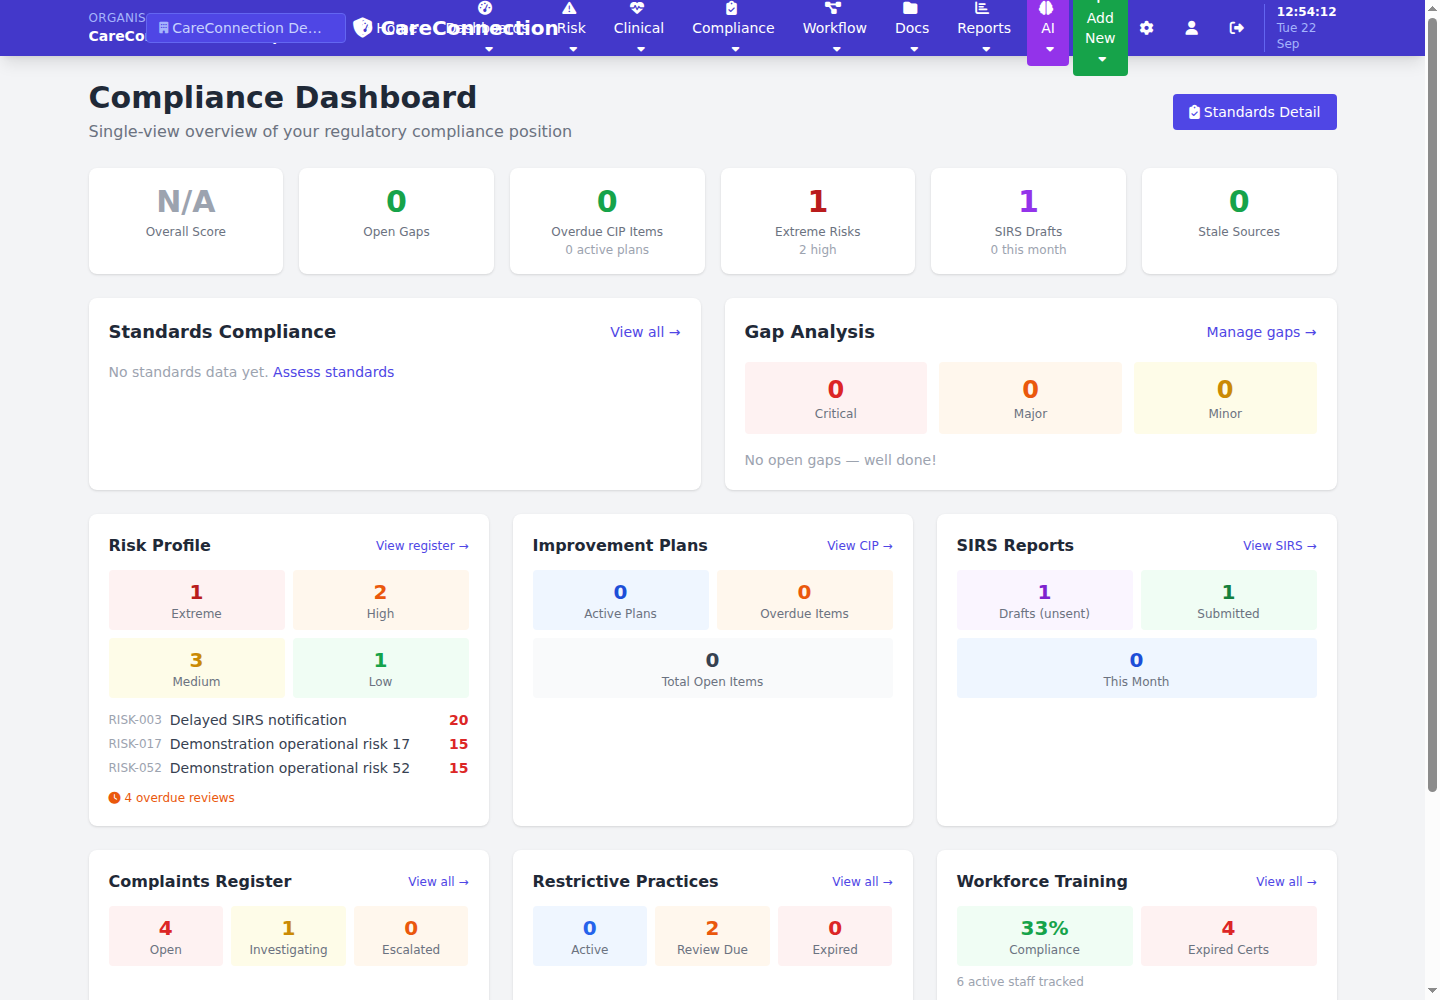
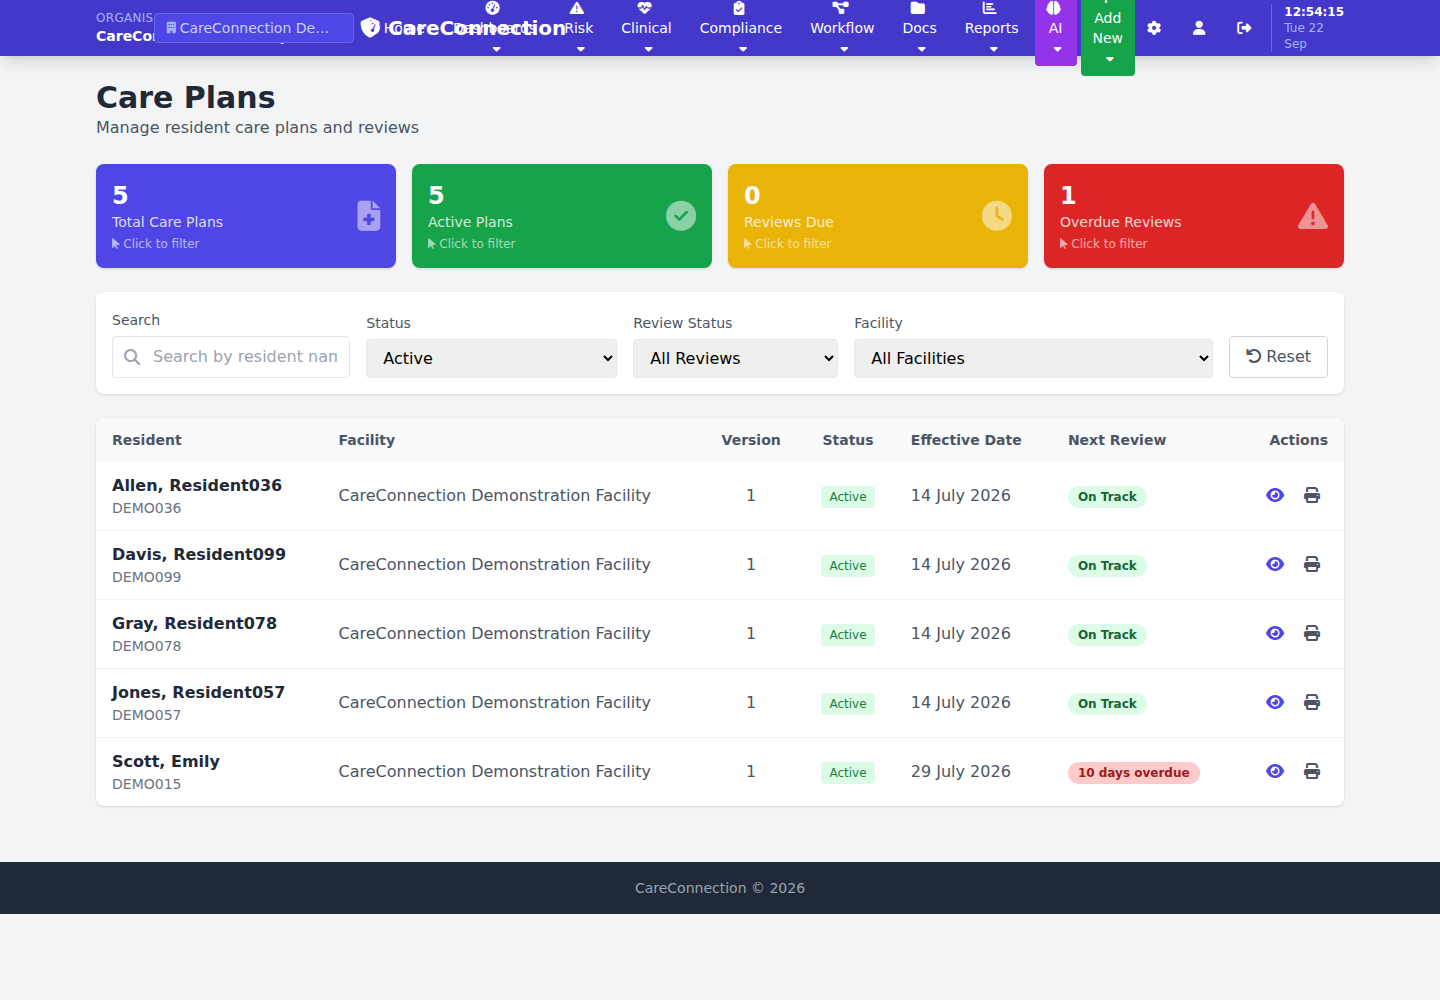
Illustrative screens with demonstration data.
Clinical risk insight, live inside the platform.
A review-only AI risk panel already runs against resident profiles across four clinical domains. Each is measured against a recognised standard. The same pattern extends to workforce and financial data.
- Only typed, provenance-tagged inputs are used, never a whole record or free-text narrative.
- Results return as a reviewable flag inside the system your team already uses.
- No raw model output is stored or shown. Only the evidenced outcome is.
- Nothing is actioned automatically. A named person confirms, adjusts or rejects.
See the platform through your priorities.
Tell us where risk, compliance or care coordination is hardest today. We will show you the relevant modules, the evidence trail and a sensible first step.
- A focused walkthrough, not a generic tour.
- Real, de-identified examples.
- No system replacement required.
Start the conversation
We reply within two business days.
Thanks — we'll be in touch
We reply within two business days.